This is the 13th alpha release, 2.1.0. We’ve bumped the minor version number because this release includes a big new feature, serial terminal (although it is just the core feature much more to come).
As always, we would love to hear your feedback on every release! Reply here or create another thread.
We’re currently focused on analyzers and making the digital usage, as Joe always says , awesome!
Much quicker and a big UI improvement. Thanks for working on an improved application. Getting better every day
Is there an ETA on analyser SDK support?
The thing that is stopping me using 2.1.0 (the latest Alpha) all the time is the fact that I do not have access to the local and 3rd-party analysers needed for some of the protocols I need to work with.
General comments for future work:
As others have requested multiple times: The ability to trim captures is a must in my book. Whether that is editing inline in capture (trim from start to marker, or marker to end), or has been suggested in some other comment the ability to extract a marked section to a new capture tab, is a design decision (with the latter probably being easier/safer to implement).
Improved annotation. e.g. provide for user-editable labels to be attached to Tx markers (so acting as “bookmarks” that can be used for timing comparison as well as provide useful annotations when documenting/describing a captured trace). Maybe the user-annotations titles could be displayed as suitably coloured bubbles in the top of screen time graph beside their corresponding timing marker number. To date I have had to resort to stitching together screen grabs of Logic 1.2.29 and using gimp to create graphic annotations highlighting parts of traces when describing problems to 3rd-parties. Not the quickest or cleanest of solutions
Thanks for the feedback! I’m glad to hear that you can feel the difference
There is no ETA for the SDK, however, we’re already planning that feature and we’ll have better understanding in a week or so. What would you like to have in that SDK? Some ideas?
Python analyzers
High-level analyzers (analyzers that their input is another analyzer)
Support the old analyzers
Anything else?
We’re definitely going to add annotations. We tried to replace the Tx number with text but it looked quite awful (the label was too big many times). The current plan is to add notes to the markers and allow you to pick their color. You’d be able to see the note when you hover the marker or when you open the note from the sidebar.
What do you think? Does it answer your needs?
Please keep up with the feedback, it’s super helpful!
Rani
Before proceeding with a real case test, one comment about the selection of channels on the Capture Settings pane. The colour of the selected channels is hard to read.
Why not using the same interface from the Export Raw Data pane? The only minor improvement would be to put the numbers of the unselected channels in gray, as in the previous pane. So combining the best ideas from both panes would be really great, and would ensure consistency across the app.
Thanks for the feedback, these are valid points.
I’ll discuss it with our designer and he’ll reply to you on Monday. I’m sure that his answers will be better than mine
What would you like to have in that SDK? Some ideas?
Support the old analyzers
If the C++ analyser API is still applicable to the new codebase model then it would seem sensible to maintain it to allow re-use of the existing analysers.
C/C++ has performance on its side, which could be critical when live capturing and analysing.
… We tried to replace the Tx number with text but it looked quite awful …
Having coloured notes as you describe (popup on hover, or in the side panel) would be a good baseline.
Off the wall suggestion: Having an annotation mechanism that uses the analyser support; but allows for UI interaction for injecting the text contents of new bubbles (as well as the colour and timespan of the bubble) associated with a timepoint and channel(s).
This could allow for arbitrary length bubbles covering large sections of the trace if needed to highlight a sequence of transactions for example. That way it would be possible to get a quick visual representation/feedback of interesting annotation points when zooming and panning a trace without having to deal with opening the side panel or manually selecting a marker point.
The upside being that it could use the existing analyser codebase, with hopefully minimal extra functionality needed for the “manually inject AnnotationAnalyser data at this timepoint”. Especially if you implement your nested analyser support, since the AnnotationAnalyser would just be a level in the analyser hierarchy.
I’ll describe your idea in my own words to make sure that I understand:
You’d like to select an area of a channel and automatically create a note with the content of the protocol results (bubbles). Something like that, but not as ugly :
Not exactly. It would be for arbitrary text, not for data already gathered/generated by “another” analyser. It is where I could add my notes for describing what I want to record/track/highlight/annotate for that region.
So a zoomed out view might show 3 annotations (so using the same render engine as the analysers for consistency, code reuse, etc. but with my arbitrary text and colour selections - from a suitably designed palette )
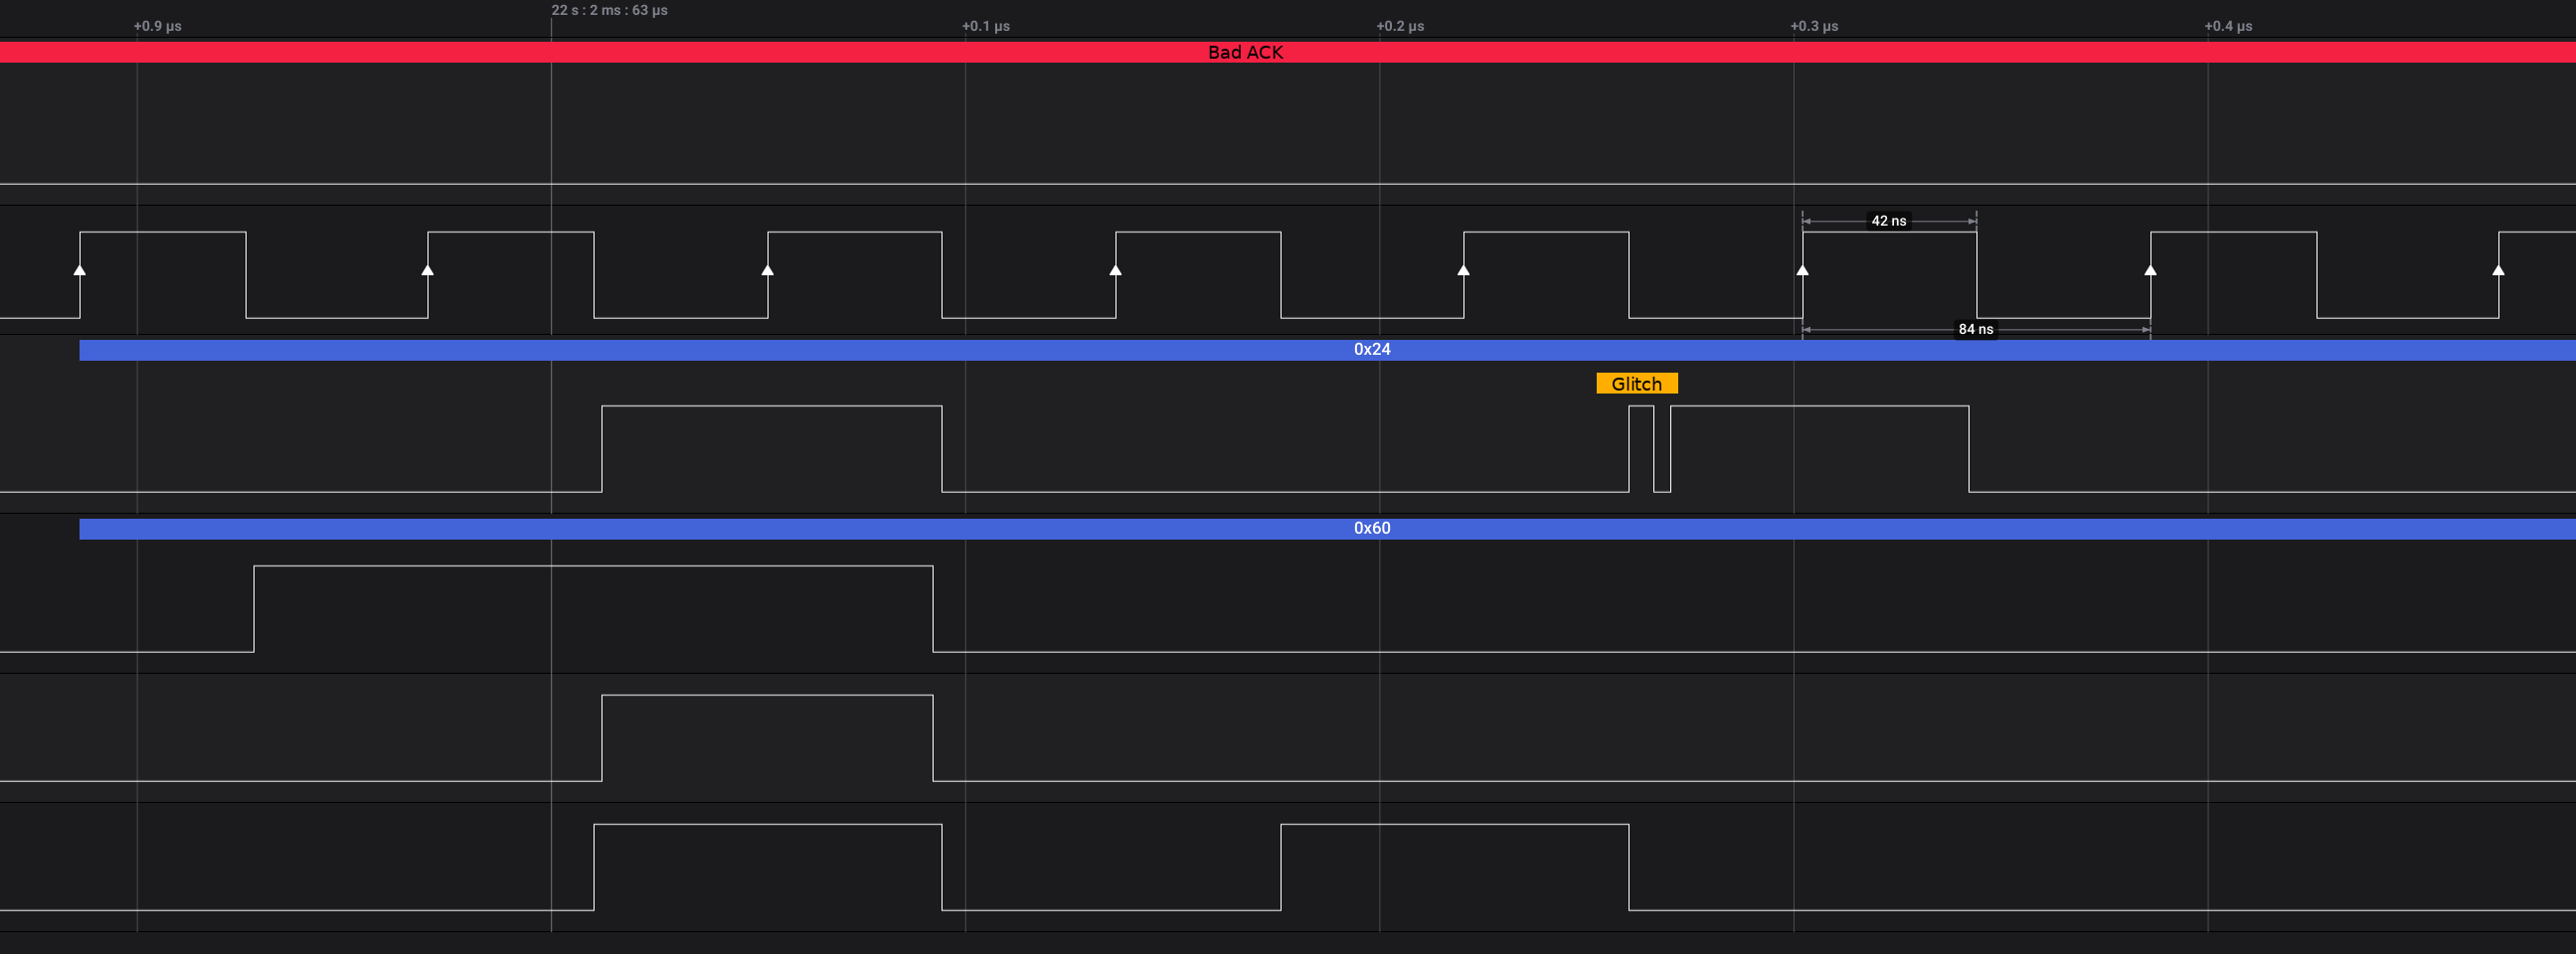
So the text in the “analyser generated blocks” (which I incorrectly referred to as bubbles, hence the possible confusion) would be truncated, and handled just like the code already does for the blue analyser generated text. So when zoomed in we may see more annotation detail (for example my manually added orange “glitch” annotation):
As long as the annotations appear in the side panel for the AnnotationAnalyser (or whatever it is called) we can see all the annotations covering the whole capture; and be able to click on them to take you to that point (much as the current analyser and bookmark stuff does).
On my version Windows 7 pro which is running well the 1.2.29.Beta the 2.10 alpha isn’t able to be launched (blue circle during some seconds on the mouse pointer but nothing else happens).
It makes more sense now. Thanks!
We’re planning to implement something very similar to that where you can select a specific area of a channel, get some measurements for that area (duty cycle, average frequency, etc) and annotate it. I think that it would answer your needs.
Thanks a lot for the feedback, it’s really helpful
Hi Rei, thanks for taking the time to provide feedback! We are working on making the channel selection interfaces consistent across the app. The design change should roll out in a few releases.
To improve readability, we are also making sure the contrast between the text and the background is passing the WCAG accessibility test. We will continually improve the design of the app and feedback like yours help us a lot. Please keep them coming!
is it just me, or is there no “glitch filter” in it ?
The rest looks, and works great, the protocol packets are easy to read, even if you plan to make it even better.
Could you tell me a little about how you use the glitch filter? We’ve been working on it for the last few days.
We built the glitch filter originally to solve the problem of recording I2C traffic with the Pro devices, which have very little hysteresis. The open drain nature of I2C causes a lot of double-hits on the rising edges of the signal, due to the slow rise time.
Also, in general, if the threshold voltage of the Pro devices isn’t well matched to the recorded IO signal level, it also double hits quite a bit.
What do you use the glitch filter for?
What filter widths do you usually use?
If we had a maximum limit of 10ms or 100ms for the glitch filter, would that be a problem?
Also, a major design decision we made for the new filter is that it’s applied to the data as it’s recorded and it actually modifies the data that is stored. The original glitch filter was done in post-processing, which allowed you to edit the filter after data was recorded. This was way more complicated than applying the filter as the data is recorded, but the new system means that you can’t change the glitch filter for an existing recording - if you want to change the glitch filter settings, you need to run the capture again.
How would this affect your workflow?
 , awesome!