I have added the https://github.com/adafruit/Logic2-SPIFlash decoder from the build-in plugins. I then read a SPI flash chip which I already know the contents of, and I want to confirm I can understand the QSPI trace in Saleae.
I am reading from a MT25QU128ABA SPI flash chip which I have powered at 1.8V, and set the Saleae logic levels to 1.8V and 250MS/s. All the data while it’s in single SPI makes sense and correctly corresponds to the data I see in the flash dump. However, once it transitions to QSPI the data doesn’t seem to make sense anymore.
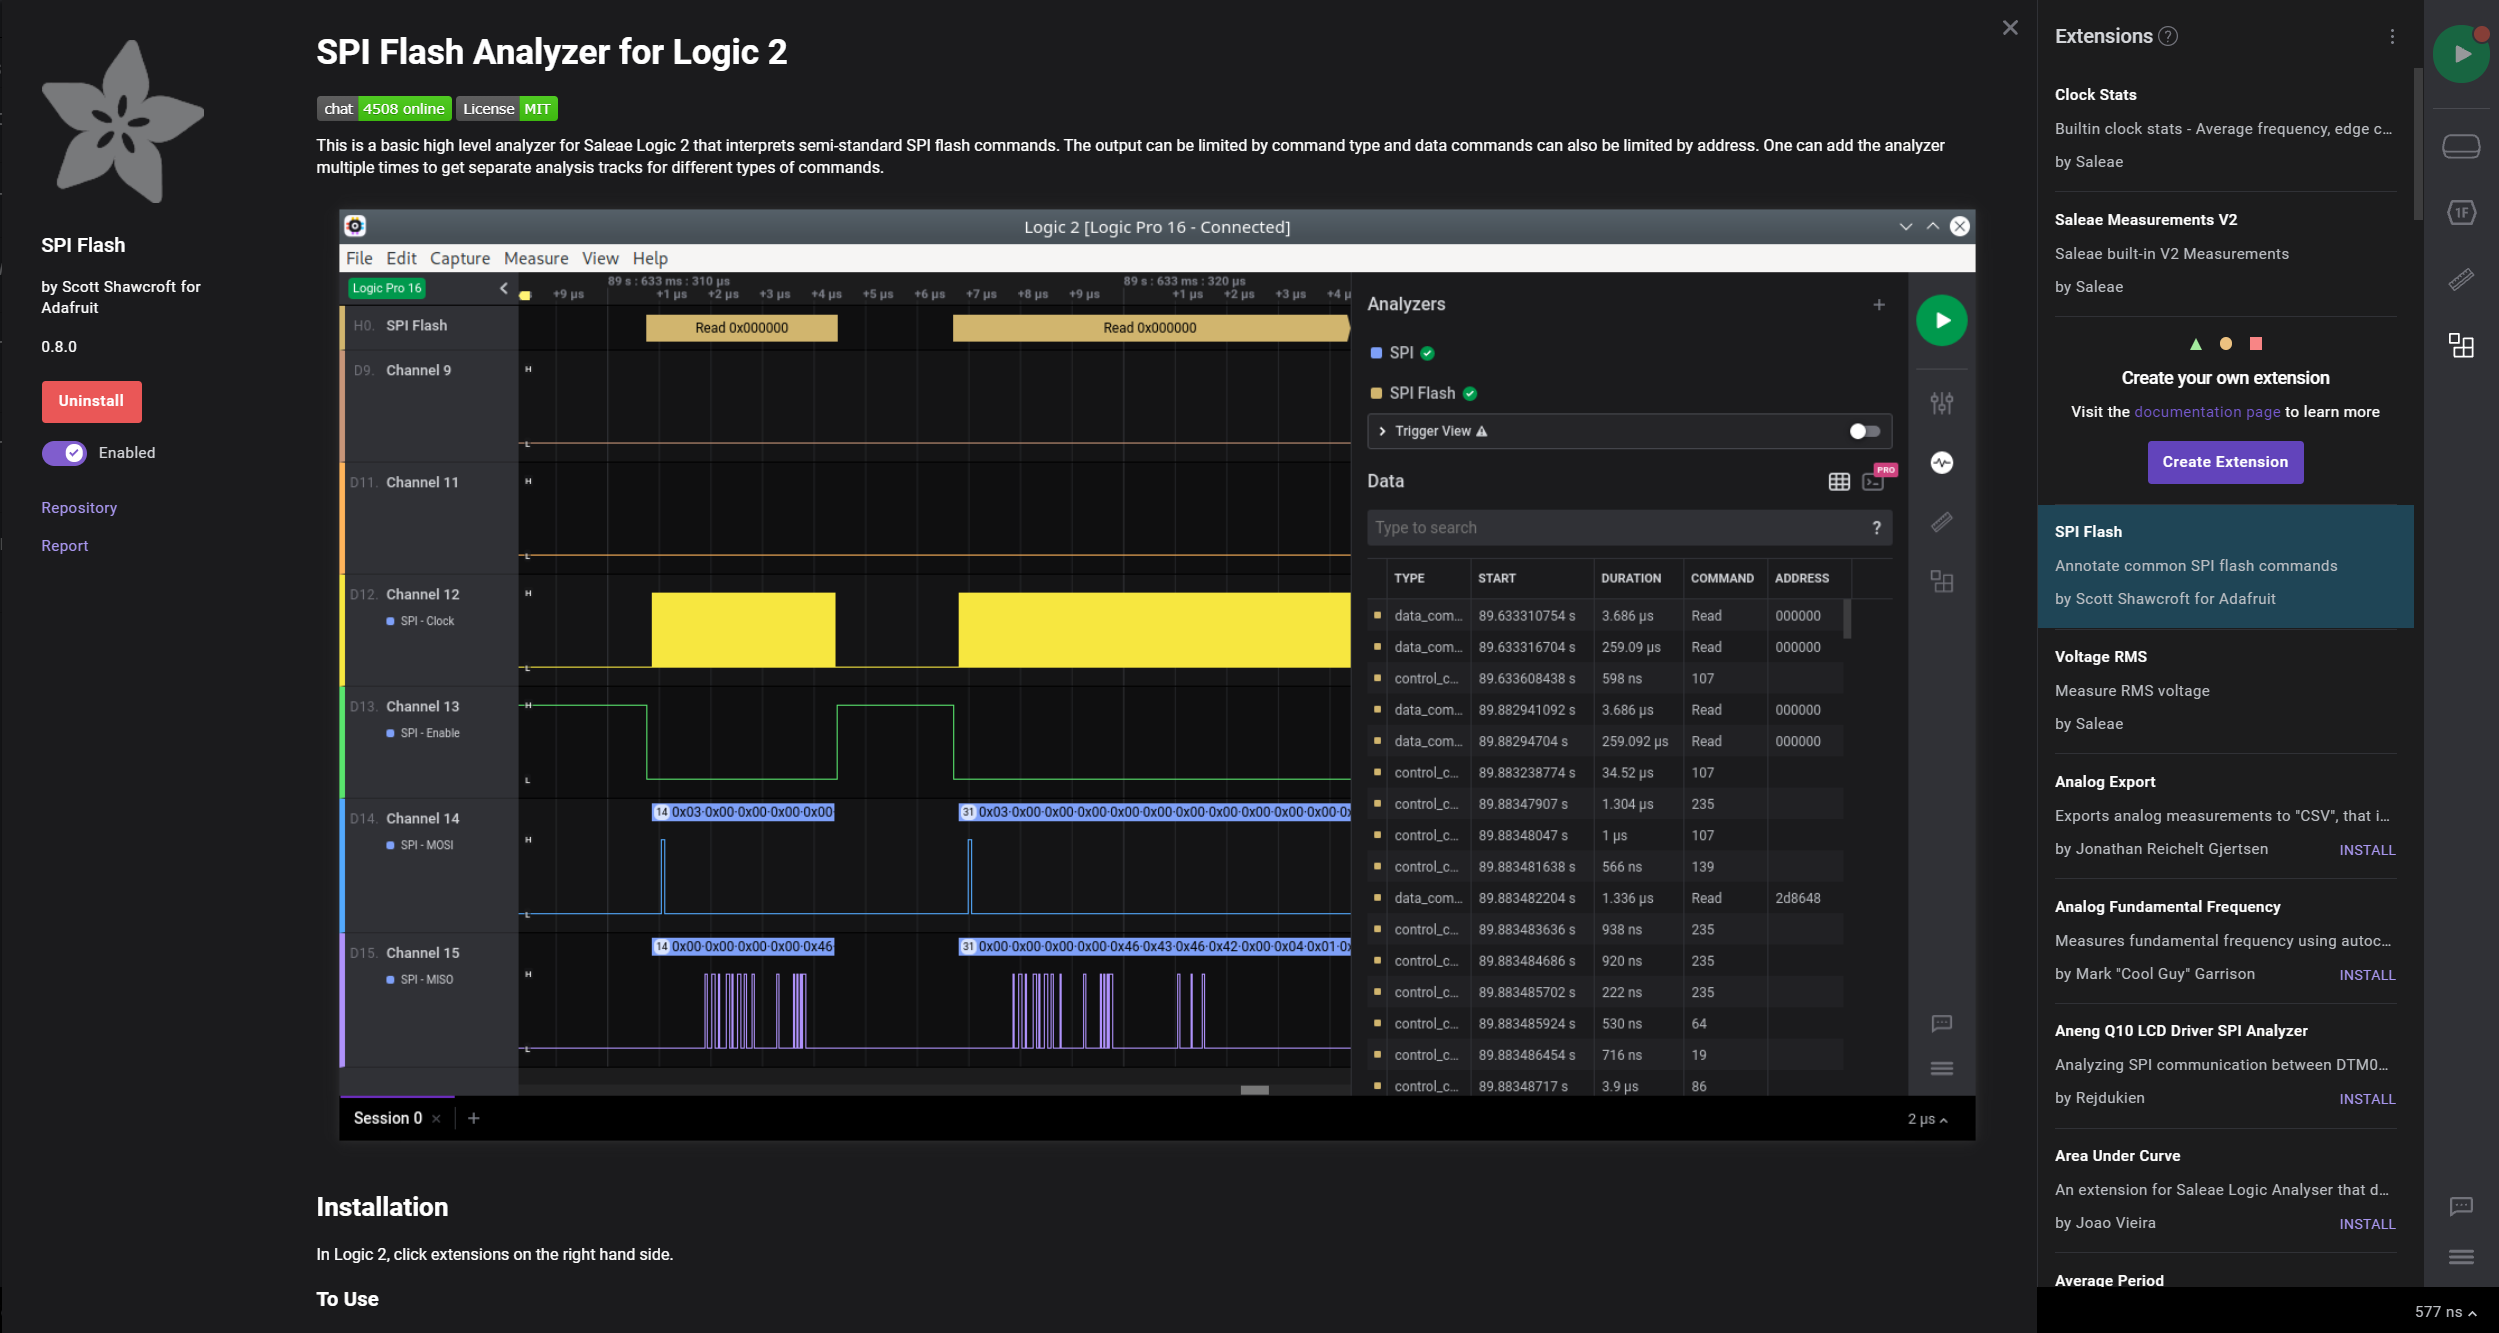
In the following picture you can see that it issues opcode 0xEB (quad fast read), followed by the address (0x800030).
Even if I had the pins wrong, I’m still not seeing an interpretation which could yield the correct hex output bytes, even if I’m decoding it by eye (reading bits vertically.) (Here’s a zoomed-out picture to show what I mean about no obvious pattern like 0xEE 6B" showing up even when eyeballing it)
In your last image there are some very narrow clock pulses. Could it be that you are getting glitches on the clock line? The logic analyzer has very little hysteresis so poor grounding or noise on the signal lines can cause havoc. Try turning on a glitch filter on the clock line.
In general I see what you’re saying, but although the clock pulses are sometimes a little shorter, I don’t think they’re glitching. For instance if I then zoom in a bit more on the initial portion where the command and address are shown, they’re decoding correctly (AFACT).
In general based on this chip’s behavior, during single SPI I generally see the signal going high for 8ns, with the occasional 12ns mixed in (but it didn’t affect the single SPI decoding). Whereas in the quad SPI range I still mostly see 8ns, with an occasional 12ns, and those occasional short ones which are 4ns.
I don’t think I necessarily have poor grounding (the connection there seems solid), but I can’t discount the possibility of noise, since there’s a bunch of wires all next to each other for the custom adapter I needed to make to connect to SPI here. Given this, do you think a glitch filter on the clock line would still be likely to yield different results?
I suspect the variation in width of the clock pulses is just a sampling artifact. At 250MHz sampling your sample period is 4ns so that is the quantization you will see in periods. If you can sample at 500MHz (2ns sample time) that will help. I’m somewhat surprised there is as much variation in clock pulse width as implied by the variation though. It may be interesting to put a scope on the clock line and see what the signal rally looks like?
I now doubt that you are seeing the effects of glitches, but the variation may be due to relatively slow edges. Do you have line termination resistors on the signal lines to reduce reflections (typically a series 50 Ohm resistor at each end of the trace if the trace is longish)?
(OK, just incase, I went ahead and put a 4ns glitch filter on, but that then yielded much less-sane data in terms of the addresses that were being read via QSPI, so I’m fairly certain now it’s not glitching)
I went ahead and increased it to 500MS/s, and now the "4"ns showed up as 6ns, and the “12” as 10. So it’s basically there’s that small range of variability from 6-10ns for the pulses, with most being 8ns.
As for putting an oscilloscope on the clock line, unfortunately I don’t own an oscilloscope. The Saleae is my initial foray into this level of hardware. And thus likewise I’m not sure I fully understand your question about the termination resistors. If you’re asking if I have added 50 Ohm resistors in series between the Saleae and the board, I have not, as I didn’t know that was required. If you’re asking if they exist in the SPI trace design on the board, that I wouldn’t know, because it’s not a board I’m designing. It’s just a little Intel Atom board that I’m trying to sniff the SPI traffic on, so I can learn what an x86 chip accesses at boot time, in what order (I’m trying to go beyond my software-level understanding of it.)
(I should also probably say that the data is at least consistent in terms of what it’s seeing from one run to the next in terms of the QSPI interpretation. It’s not what I expected based on what’s on the flash chip, but it’s at least the same every time. Which is why I thought I was just not understanding something about QSPI interpretation.)
The termination resistor thing is a design practice for high speed lines to reduce some signalling issues. As it’s not something you are designing don’t worry about it.
The Saleae analyzer can do scope type measurements, but too slow for these signals. We often think of digital signals as just being ones and zeros, but they are real world electrical signals and understanding what is actually happening can be very complicated for high speed. Depending on the actual signals on the wires, what the logic analyzer sees and what the processor see may be quite different things. Unfortunately a good scope is pretty much the only way to get a handle on what might be going on at the signal level.
Would the variability of the clock pulses actually be able to lead to a difference in data interpretation in this case though? Because the data’s just considered valid at the rising edge of the clock on this SPI chip, and it looks to me like the rising edge is never particularly close to an edge on any of the data lines in this picture (as emphasized by the “simple parallel” analyzer putting in the dots pretty close to the middle of everything everywhere):
So it looks to me like even if the clock were slightly earlier or slightly later going high, it wouldn’t generally affect the interpretation would it, because the data lines seem to be pretty consistently 22-26ns wide?
It does look OK, but if the data decoding is wrong compared to what you think it should be then there is an implication that the logic analyzer is seeing something different than the processor. My best story for that is that the analyzer is decoding the line states differently than expected. Beyond that, I have no ideas!
@r0h I’m happy to take a stab at this one if you send me your capture file (in .sal file format).
Feel free to trim your capture down as well using the instructions below:
To help isolate the decoding issue, you can trim the capture down to just the transaction involving “Quad Read 0x800030.” If relevant, please also share the “SPI Flash” extension settings that you use (since extension settings aren’t saved in the capture file).
I kept two transactions, reading from 0x800030 and 0x800020, the data for which looks like this in a flash dump (which parses fine overall as an Intel firmware so I know the data is correct)
@r0h After reviewing your capture file, I’m unfortunately not able to find a pattern that resembles the data below:
The data from the SPI flash dump at address 0x800030 is
05 00 00 00 00 02 00 00 00 EE 6B 00 01 00 00 00
I was mainly looking for 0xEE, or any combination of three 1s and a 0 clocked in at the same time, twice in a row.
Having said that, I did notice a mismatch in the number of clock pulses between the two transactions, and I’m hoping that provides some sort of clue as to a missing clock edge. I’ve attached an image below. You’ll notice a faint gap (missing pulse) around 1/3 of the way through the first transaction (0x800030).
As a second note — you might want to try a community user’s QSPI analyzer below:
In case you are on Windows, they provide an x64 release .dll file (QSPIAnalyzer.dll) that you can quickly install into the app via the instructions below:
I had tried a fork of a fork of that saleae_qspi project before (something that claimed it fixed some stuff) and it wouldn’t load. But I tried that original just now and it worked!
What’s most important there is that I didn’t have the AdaFruit “SPI Flash” analyzer reading from the “Simple Parallel” input (as they specifically say to do for QSPI), but instead the “SPI” input. So the address being read is 0x100000, not 0x800030 like appears in the above and previous screenshots. Of course I only figured this out after I installed the QSPI analyzer. Here it is with the correct config, showing it recognizes the correct address once configured properly.
Now as you noted, there is a missing clock cycle after the 0x0D, so that ultimately causes the interpretation to shift by a nibble and 0x01 looks like 0x10, 0x04 → 0x40 etc. But basically I could just skip past that initial faulty transaction by deleting the data, and then the rest of the trace seems to be fine as far as can tell by a little bit of spot checking.
Also of note is that I didn’t have my SPI reader connected anymore so I couldn’t double check what the control registers said the number of dummy cycles should be, so I just put it as 10 (rather than the analyzer’s default of 8) as that seemed to be the default in the manual for this SPI part. And that seemed to be correct once this QSPI analyzed processed the data.
So the mystery is solved: The parallel interpretation of QSPI starts immediately following the 0xEB command (as it says in the manual, but I’m new to reading those charts), and then the dummy cycles need to be accounted for before interpreting the returned data (which I was kind of wondering why there was no dummy cycles after the address in my previous attempt at QSPI eyeballing.) So given all of that, of course the proper QSPI plugin is a must-have for understanding the data when one doesn’t already know how to read these signals.